Next MeetingNewsletterPast NewslettersAmusement Park Related


Summer Edition September ’01

VIP’s mission is to foster communication among teachers of physics
and physical science as well as to provide unique learning experiences
for
teachers and their students.


October 19-20, 2001, at VAST at the Richmond Marriott – Register now to attend!

            We will host three presentations at VAST this year! Currently they are as follows:

  • VIP Share Session – Friday, October 19 – 9:00 AM – 9:50 AM
  • Big Questions in Physics Today - Friday, October 19 – 10:10 AM – 12:00 Noon
  • Demos, Labs & Lessons to Go-by V.I.P. – Saturday, October 20 – 12:00 Noon – 1:50 PM

Registration details can be found at http://www.vast.org

March 23 at UVA’s Physics Building – Details in next newsletter


Click here to download his entire newsletter in Acrobat Reader 4.0 format.
The latest version of ACROBAT READER can be downloaded from http://www.adobe.com. It is free!


Back to the top.

November 3 in a Field outside of Culpeper – Rain Date November 4

            Plan to attend the Tripoli High Powered Rocket launch.  See http://www.ColonialVirginiaHPR.org/virginia.html map directions and information.


Back to the top.

Last year we held three meetings.  We kicked of the school year with a meeting at the Virginia Science Museum in Richmond on September 23.  We were provided with a conference room and free access to the museum.  Out of that meeting came the idea for a survey to determine trends in physics teaching in VA.  Results of the survey are included later in this newsletter.

Our second meeting  is in conjunction with the VAST conference in Roanoke on November 10 and 11.  Here VIP provided two presentations at a conference where there was a much stronger physics presence than in past years.  This was the first time we had attempted more than one presentation. It was such a success we’ve upped it to three this year! 

Our third meeting was held on March 31 at UVA.  We had 30

people in attendance.  It was fantastic! At this meeting we agreed

to continue our presence at  VAST.  We also elected officers. Andy Jackson was elected President and Thomas O’Neill as Vice  President.  There were 12 different individuals who presented at this meeting!  So many people

Tim Couillard presents at UVA 3/31/01

attended and came prepared to present that we couldn’t do it all.


This meeting culminated in a trip to UVA’s Crash Test facility.  Thanks to Thomas O’Neill for organizing our “field trip”- definitely a high interest place to see.  And thanks once again to UVA’s Physics Department for hosting us and for printing and distributing this newsletter.


Back to the top.

1st & 2nd Day of School

Start it off with a BANG! On the first day of school, I like to capitalize on the intrinsic excitement that is already there. I do a series of about a dozen demos and brief student labs that touch on all the different topics that physics encompasses. I explain, historically, why it is such a hodge-podge of things. It’s a great time to do some exciting demos that are great gee-whizzers but don’t lend themselves to deeper instruction. (I reserve those for later). I have the students write down their best guess for explaining the demos & labs. I give the “Baseline test . . .” worksheet as homework on the first day of school. I make it clear that the student gets full credit for simply trying all the questions and that it is pledged work. I use it as a diagnostic tool. This year I’d also like to try to use it to pair up lab partners for the first couple of labs, and as an assessment to see if these basic skills have been mastered by the mid-term and final. On the second day of school, we go over the worksheet. I have the student grade his/her own and make corrections as we go over it. As we go over the answers, I take time to instruct. Then we start our second lab of the year “Do you measure up?” on day two. In this lab, the student applies almost everything we went over on the “Baseline test . . .” worksheet.

Andy Jackson

Back to the top.
There are two ways you can enjoy VIP from your computer at home or at school.  There is the VIP web site  maintained by Tony Wayne. (Thanks Tony!!) You can access this at www.vast.org/vip/


Tony has collected past newsletters, and amassed a great collection of physics links all at your fingertips.

The second is through our e-groups account.  If you become a member of the Va-Inst-Phys group, then you can ask that bothersome question or recommend that great book anytime you want.  I have thoroughly enjoyed “listening” to and participating in the various conversations that have gone on.  This is a great way to stay in touch with physics teachers across the state.  Send an email to  va-inst-phys-subscribe@yahoogroups.com and our  moderator, Ron Revere,(Thanks Ron!) will add you to the list.  No junk mail, just a pleasant amount of physics education related conversation.

Back to the top.

Baseline test: Math, Metric, and calculator skills.


USE RULES FOR SIGNIFICANT FIGURES                                                       

FOR ALL PROBLEMS                              Name_________________

Period  ______

Date turned in__________

Indicate the number of significant figures in each number.

1.      0.004       

2.      229

3.      6500

4.      12.00

5.      103

Perform the stated operation on your calculator.

6.      8.45 x 10 -8 - 3.30 x 10 -9

7.      9.8 x 10 5  x 2.6 x104

Express in scientific notation

8.      0.002

9.      650000

10.    10020

Solve each problem below as directed. Show your work.

11.    solve for t

    y = x + at

12.   solve for x


13.    solve for b                    14.    solve for g


Do the following on your calculator.

16.    3 ÷ 7582

17.    sin 32°

18.    cos -1(0.955)

Convert the following. SHOW YOUR WORK

19.    3 m2 to cm2


20.    100 cm3 to liters


21.    34500 m to km


22.        convert 1 century to seconds. (SHOW YOUR WORK)

23.        13.6 kg to mg


Back to the top.

"When  you can measure what you are speaking about, and express it in numbers, you know something about it; but when you cannot measure it, when you cannot express it in numbers, your knowledge is of a meager and unsatisfactory kind:  it may be the beginning of knowledge, but you have scarcely, in your thoughts, advanced to the stage of science."

                        -  Lord kelvin  1824-1907


        Physics is a science of measurement. It is important that all measurements are taken as accurately as possible and recorded in a manner which conveys to the reader the extent of the accuracy of the measurement.

         OBJECTIVE - You will make measurements as accurately as possible. You will record these measurements with the correct number of significant figures. You will complete simple calculations using the rules for significant figures.

         PROCEDURE - Use a ruler to measure the length of the wooden block.  Remember to record all data as it is taken and to always try to take more than one independent measurement. Do NOT mark on anything but paper!

         There are several things I would like to know about the block. I would like to know the area of the top surface in cm2, the total surface area in m2,  and the volume of the block both  in cm3 and in liters. Save these calculations for after all your measurements are completed.

         Now mass the block. Calculate the density of the block. Present all of this information in a well organized manner. Make sure and correctly use units and significant figures.


Analysis

1.  What is meant by the term "significant figures"?  What is the purpose of significant figures? 


 2.  In determining the volume of the block, what measurement most limits the final answer?  In other words, if you needed a better answer, which measurement would you need to know better?


3. In determining the density of the block, what measurement most limits the final answer? In other words, if you needed a better answer, which measurement would you need to know better?


This next item worked great for me at the end of the year last year. I assigned it as a research paper. We spent one class day in the computer lab & the rest was on their own. I had two government teachers and an English teacher accept these papers for credit in their classes. The kids were thrilled! I thought it was a neat interdisciplinary topic and some kids got a lot out of the research.

Andy Jackson


Back to the top.

Question.

  1. Why has California been experiencing blackouts and insufficient electrical power?
  2. Is this likely to occur in Virginia in the future?

Answer

  • The answers to these questions are almost assuredly going to contain opinions.  These opinions need to be your opinions based on the research you do.  DO NOT just adopt someone else’s opinions.
  • The answers to these questions need to be backed up by facts and figures.  Your answers may be supported by “expert” opinions also, but not solely on other people’s opinions.

Format & Requirements

  • It's my expectation that these questions would require somewhere around a couple of pages to answer thoroughly.  If you can do it completely in one page - fine.
  • The paper needs to be word processed.  Double space using 12 point in a             standard font.
  • If you can get another teacher to accept this research topic as an assignment in his/her class, and there is a specific format that must be used, please submit those requirements with the paper to me so I don’t grade off for something another teacher is requiring.
  • Site all sources using a correct format.  Due to the political nature of this question it is essential that you obtain information from a variety of sources.  I would consider 4 sources to be a minimum.


Back to the top.

Have you ever used a lab component in an exam? Here is the last page of my final exam. I have students collect this data before the exam period but have it available to them during the exam if they need to go back and re-measure. They have graph paper and computers with graphical analysis available – their choice. The coil sets are available in several of the catalogs

Andy Jackson


This portion of the exam counts for 40% of your total exam grade.  Honors 8 pts each . Regular Physics 10 pts each.


PURPOSE- Does the student know how to apply the scientific method to a new situation? Can the student collect and correctly interpret data? Can the student create and use graphical representations of that data?


MATERIALS- Multimeter, coils of #30 Nickel-Silver wire of various known lengths from 40 cm to 200 cm, a 200 cm coil of #28 Nickel-Silver wire, and a 2000 cm coil of #30 copper wire.


PROCEDURE- Design and conduct an experiment to determine the answers to the following questions. With the equipment provided, the depth to which you can answer each question will vary. Answer each to the fullest the equipment and your abilities allow. The answers need to be based on your data.


A.    How are the length of a metallic conductor and its resistance related? provide a table and a graph that support your answer.


B. # 28 wire is of larger cross sectional area than #30 wire. How are the diameter of a conductor and its resistance related?


C. Which is the better conductor, Copper or Ni-Sil?  Explain and defend your answer.


D. For equal lengths and diameters how many times better is one than the other? (Show all your work)


(Honors) E. Resistivity is a property of a material.  Resistivity is given by the following equation 

Where R is resistance, A is cross sectional area, and L is length.  Copper in any shape or size has a resistivity of 1.7 x 10 -8 W m.   Using this information and your measurements, determine the diameter of #30 and #28 wire.


Back to the top.

Purpose


  • To gain an understanding of Snell’s law.
  • To learn the terms incident, normal, refraction, critical angle, index of  refraction, and total internal reflection

 .


SAFETY NOTICE - Do not look directly into the laser or at a brightly reflected beam. Do not shine the laser in a way that could cause someone else to look directly into the laser.    Play nice!      


Equipment

            laser                                                                 straight pin

            paper                                                               protractor

            D-shaped dish filled with water                       cardboard

Pre lab

            Waves change their direction when they enter a new medium at an angle. If we used a rectangular dish the light would be refracted (bent due to a change in medium) twice- once upon entering the new medium and again upon leaving it and entering air again. This would create too many variables to sort out easily. The D-shaped dish allows us to have the light beam refract only once. If the beam is directed so it strikes the dish at the center of the flat side it will be refracted here and then strike the curved side perpendicular to the surface and not be bent again. Do you see why?


  VERY IMPORTANT- LIGHT MUST PASS THROUGH THE CENTER OF THE FLAT SIDE OF THE DISH.

Procedure-

  1. Fill the dish with water and place the dish on the paper. Trace around the dish.  Mark the center of the flat side of the dish on the paper.
  2. Use the protractor to draw a line perpendicular to the flat side.  This is the Normal line.
  3. Use the protractor to draw lines at 15, 30, 45, 60, and 75 degrees from this Normal line.
  4. Shine the laser at the dish so it strikes the center of the flat side at an angle 15o to the right of the normal line. Determine the angle the transmitted light makes with the normal line. Do this by moving a straight pin along the curved side of the dish until you see the light strike it.  Make a mark here and label it as #1R.
  5. Repeat the measurement by having the laser incident 15o to the other side of the normal line. Label the point the light exits as #1L.
  6. Do this for 30o, 45o etc. up to 75o. In each case the light is being refracted as it is passing from air into water and not bent as it passes from water into air. Label the subsequent points #2R, #2L etc.
  7. Get a new sheet of paper and repeat steps 1-6 but this time with the light going IN from the curved side and striking the center of the flat side from within the dish. In each case the light is being refracted as it is passing from water into air and not bent as it passes from air into water. Do you understand why?
  8. At some angle the light no longer is transmitted. Find the angle as accurately as you can. This is called the critical angle. Record the critical angle. Make sure you understand what happens to the light at this and greater angles.


Data table: Light traveling from air into water

  Incident Angle
 (deg.)
 I

 Refracted Angle
(deg.)
RR

 Refracted Angle
(deg.)
RL

 Average

(deg)
R

 Ratio

Sin(I)/Sin(R)


Data table: Light traveling from water into air.


  Incident Angle
 (deg.)
 I

 Refracted Angle
(deg.)
RR

 Refracted Angle
(deg.)
RL

 Average

(deg)
R

 Ratio

Sin(I)/Sin(R)


Critical Angle right side    _______    Critical Angle left side    _______      Average    _______   

I’d guess this lab, or something like it, is pretty standard. I’ve just added a couple of my own twists. I tend to not take points off for question #2 unless the answer is very illogical. Getting good results here requires careful sighting. If the laser is kept very close to the paper and the bottoms of the straight pins are used, there is usually a little less error. Here is a small time saving step in grading. I print these three sheets with the 1st page front side only and then the 2nd & 3rd on one page front & back. I then have the students only hand in the single sheet of paper with the data tables on one side and the analysis on the other. No need for me to flip through the instruction sheet.

Andy Jackson


Name___________________

Period___________


Analysis

            1. What do you notice about the ratio of Sin I / Sin R for each table?


            2. Compare the ratio for light passing from air to water to the ratio from water to air. Find a mathematical relationship between them.


            3. Snell’s law is n1Sin I = n2 Sin R  Where n1 and n2 are the two indices of refraction.  The ratio of Sin I / Sin R is called the Index of refraction when the first medium is a vacuum (or very nearly so if the first medium is air) What is the index of refraction of water? 


            4. Light is refracted when it changes mediums due to the light traveling at different speeds through different media. The bigger the difference in speeds, the more the light is bent. Light travels more slowly through water than through air. The index of refraction for quartz is 1.46 and 2.42 for diamond. Through which does light travel the fastest; water, quartz or diamond? Through which does it travel the slowest?


            5. At the critical angle all the light is reflected inside the water and none transmitted out into the air.  This only occurs when light tries to travel from a medium of higher index of refraction into one of lower index of refraction.  It is called Total internal reflection.  At the critical angle the light is refracted right along the flat surface of the dish.  What is the angle of refraction? ________ The index of refraction of air is 1.000.  Use Snell’s law and the critical angle you measured to calculate the index of refraction of water.  Show your work.

Stuart McCausland sends you this next item . It’s a “Cheat Sheet” for fitting curves to real data on the TI-83 graphing calculator. It’s a handy reference for the graphing real data that should be useful at the start of the year. Thanks Stuart!

or

How to Find an Equation When One Variable is Related to Some Power of the Other Variable


Back to the top.

Initializing the calculator:


  1. Turn on the calculator.
  2. Push the <CLEAR> key once.
  3. Push <2nd> then <0>.  This will bring up a list of functions.  Use the cursor control keys to scroll down to “DiagnosticOn”.  Push <ENTER>.  Push <ENTER> again and the screen should show “Done” on the right hand side.
  4. Push <STAT> then <5> then <ENTER>.  You have now reset the names of the data lists to L1, etc.
  5. Push <2nd> then <+> then <4> (ClrAllLists) then <ENTER> . You have now cleared all the data lists and are ready to enter your own data.


Entering data:


  1. Push <STAT> then <1>.  Your dark cursor should now be at the top of the L1 list.  Type in a number for the first variable (for example the number of seconds that something took to happen). Then push <ENTER>.
  2. Push the <right cursor arrow key> once.  Your cursor should now be at the top of the L2 list (just below the L2).  Type in the number for the second variable (for example the length of a pendulum or the distance something traveled) that corresponds to the time in L1.  Then push <ENTER>.  You now have your first data pair.
  3. Push the <left cursor arrow key> once.  Now type in the next time (or whatever variable you are putting in L1). Repeat steps 6 and 7 until you have typed in all your data pairs.  Be certain that all the data lists have an equal number of entries.


NOTE:  If you are using equations in which L1 or L2 are divided by the other one, you will not be able to have a zero as a number in either list.  For example: if you have time in L1 and distance in L2, you will not be able to have the calculator graph or calculate speed at a time = to zero since it would then be dividing by zero (which is not possible).  Consequently you will have to leave the 0,0 data out.


Setting up the graph:


  1. When you have finished entering data in the lists, push <2nd> and then push <Y=>.
  2. Push <2>.  Then move the cursor over the Off using the cursor arrow keys.  Push <ENTER> to turn Plot2 off.
  3. Use the cursor arrow keys to select plot3. Push <ENTER>  move the cursor to select off and turn it off.
  4. Use the cursor arrow keys to select plot1 .  Make sure the blinking, dark cursor is over the On. Then push <ENTER> to make sure Plot1 is turned on.  Use the cursor keys to place the blinking, dark highlight over the second graph on the picture of the second graph after the word “Type:”  This tells the calculator to draw a line graph. Press <ENTER. Now use the cursor keys to highlight the spot just to the right of “Xlist:”. Push <2nd> then <1>.  This action will place “L1” after the colon.  Move the cursor down to the space after “Ylist:”.  Push <2nd> again and then <2>.  This action will place “L2” after the colon.  Now move the cursor down and over the symbol you want to use for our mark.  Push <ENTER> after you have highlighted the symbol you want the calculator to use on your graph.


Viewing your graph

  • Push <GRAPH>.  Then push <ZOOM>.  Use the cursor control keys to scroll down to “ZoomStat.”  When the dark cursor highlight is over the “9:” in front of “ZoomStat”, push <ENTER>.  You should now see a graph of your data.


Calculating an equation to most closely approximate your data

  1. Push <STAT>.  Then use the cursor keys to highlight CALC in the top row.  A list of possible regressions will be shown, beginning with “1: 1-Var Stats”.  Use the cursor arrow keys to scroll down to “A: PwrReg”.  When the “A:” is highlighted by the dark cursor, push <ENTER>.
  2. Now you are going to tell the calculator which two data lists to compare.  Push <2nd>, <1> and “L1” will appear on the screen.  Push <,>, then <2nd>, then <2>. “L2” will appear on the screen.
  3. Push <,> .  Now you are going to tell the computer to calculate an equation that will produce a graph which will most closely match a graph of your data, and then to put that equation in the “Y=” list so that it will graph this equation right over the graph of your own data.
  4. Push <VARS>.  Then use the cursor keys to highlight Y-VARS.  A new menu will appear.  Push <1>, and a new list will appear with a bunch of Y’s.  Push <1>.
  5. Your screen will now show “PwrReg L1,L2,Y1”.  Push <ENTER>.
  6. Your screen will now show the variable “y=” with an equation after it.  Below that will be the variables “a”, “b”, “r2”, and “r”, each of them with some number after them.  By substituting the numbers after “a” and “b” into the equation after “y=” you will have the equation that produces a graph closest to the graph your data will make.  The “r2” value can be converted to a % by moving the decimal two places to the right.  This percent indicates the probability that this equation is the “real” equation for your data.  If you made very accurate measurements, and if the variables really are related by a power function (for example y = 2.5 X^2), then the “r2” value will be .97 or above.
  7. To see the equation written out, push the <Y=> key.  You will see “\Y1=” with numbers after it.  The numbers will contain at least 1 “X”.  If you did a PwrReg, then there will be only 1 “X” and it will be followed by a caret (“^”) and several numbers.  This is the equation that the calculator thinks will produce a graph closest to the graph of your own data.
  8. To visually see how closely the graph of this equation matches the graph of your own data push <GRAPH>.  Your graph will appear, and then a second graph (of the calculated equation) will be drawn.  If the match is perfect, then your graph will be covered by the graph of the equation. 


Finding data pairs

When you have the graph(s) on the screen, you can push <TRACE> and then use the cursor control keys to move a “+” symbol anywhere on the screen.  At the bottom of the screen you can read out the X and Y coordinates of any place you put the cursor. 


Extrapolation and Interpolation

You can extrapolate or interpolate by finding data pairs on the graph of the equation generated by the calculator.  OR you can use the equation (from <Y=>) to solve for the X value or the Y value when you know the other value.


REMEMBER:  The X-axis on the graph represents whichever quantity you typed into the list (for example L1) that you then placed on the X-axis when you were setting up the graph (<2nd><Y=>).  In general, both the X and Y axes will represent physical quantities in physics, and not just numbers.  Be aware of the units for these quantities.

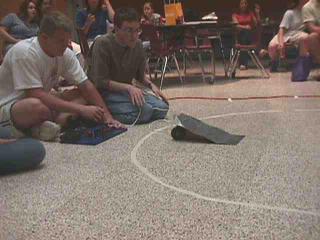
Carmageddon is a competition/project that I have had good success with the last three years. This year I borrowed(stole) the title Tony Wayne gave his competition and most of his rules. The ping-pong ball component made it very interesting and the time limit and tie rule are a must! Kits and controls are available from Kelvin Electronics. I am unaware of any other vendors carrying it. They are sold under the name “sumo cars”. Tony’s rules are available at http:// www.vast.org/VIP/CONTESTS/SUMMO

Andy Jackson


Back to the top.

The Group

• Work in groups of four physics students.

•Choose people who will work as hard as you will.

•Choose people who have skills that will compliment each other. 

•Someone in the group who has some experience with tools is a plus.

The Materials

•You may, but do not have to use, all of the materials in the kit.

•You may add additional materials.

•The car may not mass more than 3.0 kg. (that is 2.3 kg in addition to the kit.)

•The car may not be more than 75 cm long and 50 cm wide.

•You may only use the motors provided.

•No explosives, fire or potentially dangerous projectiles may be used.

The Competition

• The cars will be positioned on opposite sides of a  2 m diameter circular ring.                                                              

•Your goal is to push your opponent out of the ring while you stay in the ring within the 2 minute time limit. 

•In the event that neither car can push the other out of the ring, the car that ends up in possession of the ping pong ball at the end of the 2 minutes is the winner.

• “Out of the ring” is defined as more than 1/2 of your car being over the line.  This is as determined

by the judge.  His/her decision is final.

•If you drive yourself out of the ring you will receive a warning.  If you do it a second time in the same match you

lose.                                                                 

•If neither car is pushed from the ring and neither car is in possession of the ball at the end of 2 minutes, both cars will move to the next bracket.

•If a car is involved in a second draw it is eliminated.                                                                                                             

The No-N0s

•You may not use lethal force.  You may not attempt to damage the opponent.  It should live to fight another round.

•The electrical lead that connects the wrestler to the joy sticks is sacred.  It may not be damaged.

•Nothing other than the motors provided can be electrically connected to the umbilical cord.


•You may not use commercially created drive trains (i.e. from old remote control cars)

•OK with me any “creative” offensive or defensive devices.  I won’t give your secrets away.  I reserve the right to disqualify any car that has an “unfair” or unsafe device.

The Grade

•The team will receive at least a 40/50 for a car that can move forward, backward, left and right.  If the car can do

The “Flying Wedge” – HHS 2001 winner


these movements clearly, easily, and consistently, the score will be 50/50.  One point extra credit will be awarded for each match the car wins.  Moving forward due to a tie does not qualify as a win.


Each member on the team needs to fill out this form.  All four forms must be stapled together and turned in to me.  When I receive your forms stapled together, I will give you the kit.  (you may decide on a name at a later date)


----------------------------------------------------------------------------cut here---------------------------------------

Name______________________________

Team Members          

Car Name (keep it Nice!!!!)

1_____________________________________


2_____________________________________


3_____________________________________


I hope your year is off to a great start.  Maybe you can make some use of something in this newsletter.  I encourage you to become an active VIP member.  Attend the meetings and get on line with us!  It’s a great way to grow and a rewarding way to help out some other people.  It feels great no matter what end of the experience spectrum you are on.  I hope to see you at the VAST conference.  Looks like a good one!


Andy Jackson, VIP president

Ajackson@harrisonburg.k12.va.us


A special thanks to VASTfor hosting our web site.